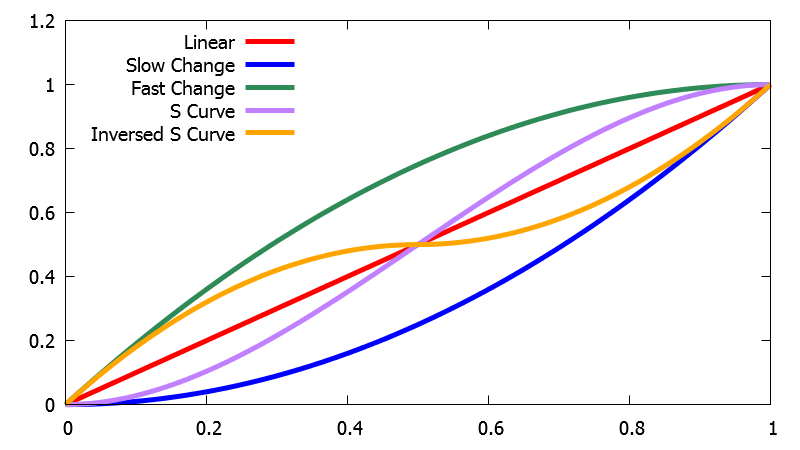
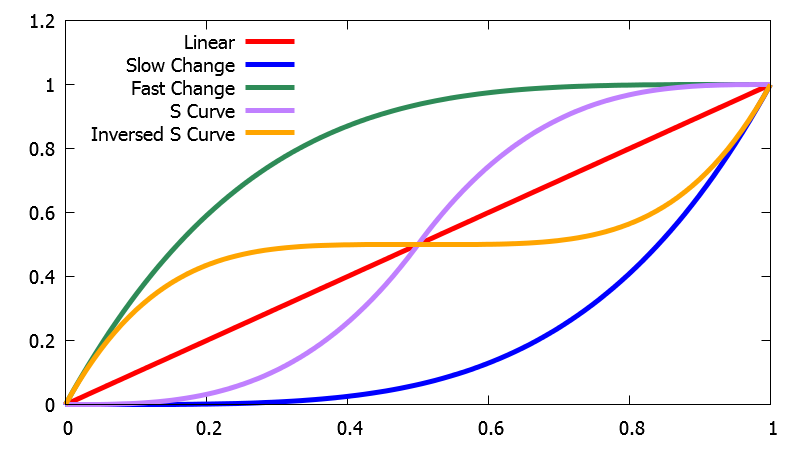
A graph curve is defined with its type and strength.
Types of Graph Curve
There are following five types of graph curve.
| Type | Characteristic |
|---|---|
| Linear | A curve with fixed change rate. (straight line) |
| Slow Change | A curve which starts with a low change rate and ends with a high change rate. The change rate gradually increases from start to end. |
| Fast Change | A curve which starts with a high change rate and ends with a low change rate. The change rate gradually decreases from start to end. |
| S Curve | A curve which starts and ends with a low change rate and has a maximum change rate in the middle. The change rage mirrors at the center. |
| Inverted S Curve | A curve which starts and ends with a high change rate and has a minimum change rate in the middle. The change rage mirrors at the center. |
Strength of Graph Curve
The strength of the graph curve specifies the sharpness of the curve (degree of change) and is valid for a graph curve that is not a straight line.
The value range is from 0 to 2, and the reference value is 1.
The graph curve becomes more linear when the strength is smaller.
The graph curve becomes less linear when the strength is larger.
When the strength is larger than 1, the graph curve has the following characteristics.
| Type | Characteristics when the strength is 1 or larger |
|---|---|
| Slow Change | Starting change rate is 0. It starts to change with a low change rate. |
| Fast Change | Ending change rate is 0. It ends to change with a low change rate. |
| S Curve | Starting and ending change rates are 0. It starts and ends with a low change rate. |
| Inverted S Curve | Change rate is 0 in the middle. |
(Note) You cannot specify the strength for a volume change curve for transitioning Tracks in a Cue of type "Track transition by selector" (the strength is always 1).
Outline of the Graph Curve
The outline of the graph curve when its strength is 1 or 2 is as follows. The horizontal axis is time or an AISAC control value and the vertical axis is the target parameter value (such as the volume).

