 |
CRI ADX
Last Updated: 2025-05-07 13:34 p
|
|
CRI ADX
Last Updated: 2025-05-07 13:34 p
|
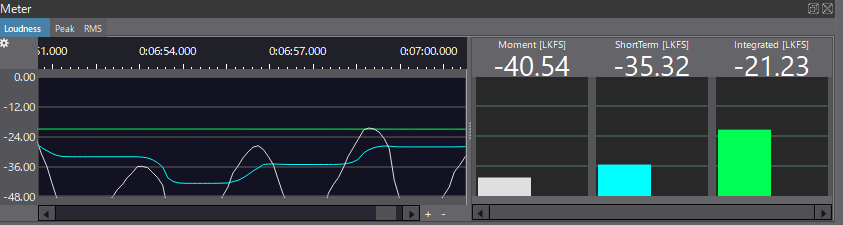
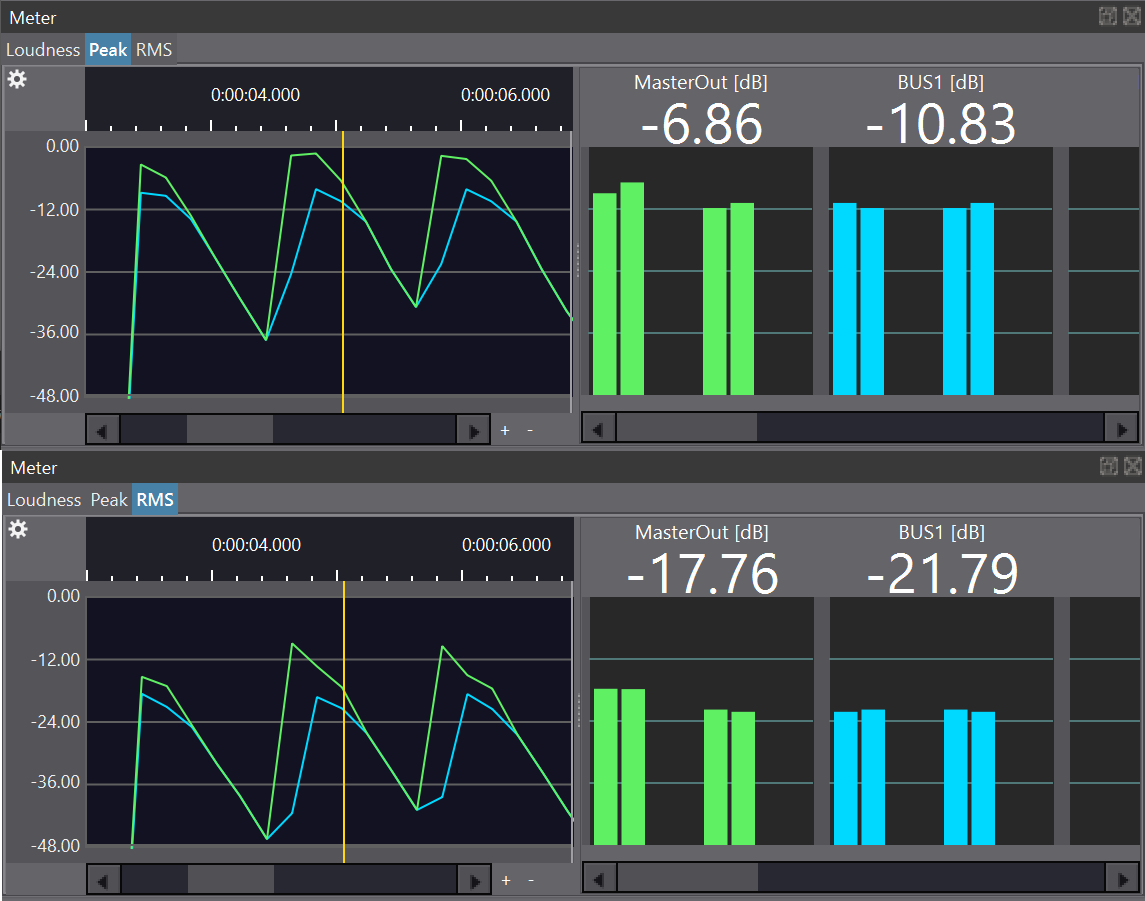
The meter viewer displays the loudness and the peak value of each bus.
It consists of two parts: a sequence viewer on the left side of the screen and a bar chart viewer on the right side.
Please refer to Profiler Viewer for details on how to use the sequence viewer.
When switching between tabs, the [Loudness] / [Peak] / [RMS] display changes.
When it is set to [Peak] / [RMS], the largest value of each channel is displayed at the top of the bar graph.
Click the settings button in the upper-left part of the meter viewer to open the settings form.
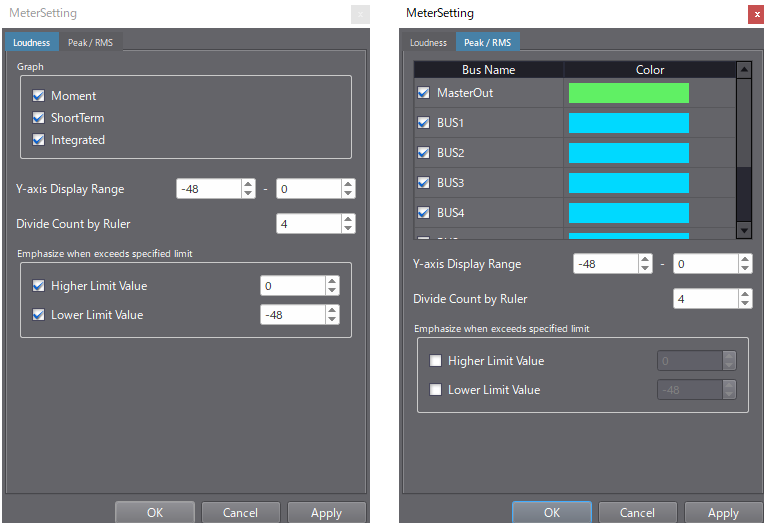
The settings are described below:
| Item | Description |
|---|---|
| Graph | Specify the type of graph to display. |
| Y-axis display range | Specify the lower and upper values to be displayed. |
| Number of divisions on the ruler | Specify the scale displayed on the vertical axis and the number of lines. For example, if the number of divisions is 4, a horizontal lines are drawn to divide the graph into four. In this case, the scale displayed has 5 marks when including the top and bottom ones. |
| Highlight setting | Specify whether to highlight the display when the value is outside a user-defined range. |
| Item | Description |
|---|---|
| BUS | Specify whether to display or not the peak value of each bus and its color. |
| Y-axis display range | Specify the lower and upper values to be displayed. |
| Number of divisions on the ruler | Specify the scale displayed on the vertical axis and the number of lines. For example, if the number of divisions is 4, a horizontal lines are drawn to divide the graph into four. In this case, the scale displayed has 5 marks when including the top and bottom ones. |
| Highlight setting | Specify whether to highlight the display when the value is outside a user-defined range. |