 |
CRI ADX
Last Updated: 2025-05-07 13:34 p
|
|
CRI ADX
Last Updated: 2025-05-07 13:34 p
|
The Performance Viewer displays a graph with time on the horizontal axis and the correspodning performance information on the vertcial axis.
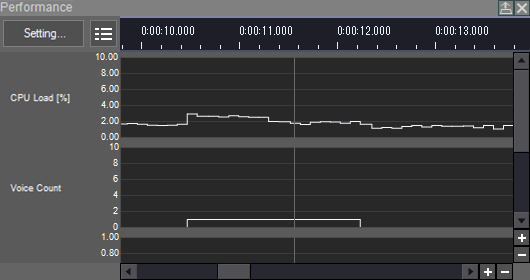
Selected a time to display the corresponding performance information (on top.)
In the Performance Viewer, you can display a graph of the following information.
| Performance Information | Description |
|---|---|
| CPU Load | Displays CPU load information (ratio of server processing time to server processing execution interval). |
| Voice Count | Displays the number of Voices being played back. Virtual Voices are not included. |
| Average Server Executing Time | Displays the average value of server processing time. |
| Average Server Executing Interval | Displays the average value of server process execution intervals. |
| Peak Server Executing Time | Displays the maximum value of server processing time. |
| Peak Server Executing Interval | Displays the maximum value of the server process execution interval. |
| Cue count in Category | Displays the number of cue sequences running in one Category. Since it depends on the data, it is not displayed before a log is acquired. |
| Streaming Voice count | Displays the number of streaming Voices. |
| Streaming total Mbps | Displays the bitrate of the streaming data in Mbps. |
| Voice count per Voice Pool | Displays the number of used Voices in each Voice Pool. Since it depends on the data, it is not displayed before a log is acquired. |
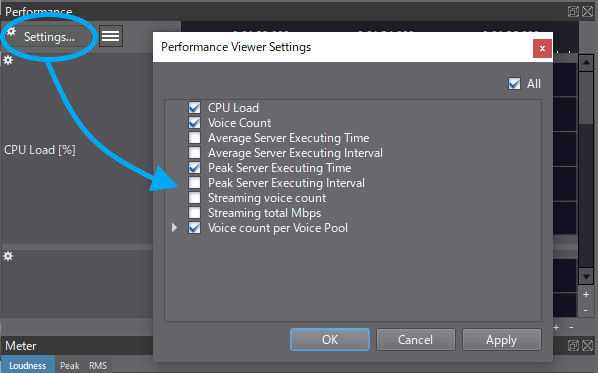
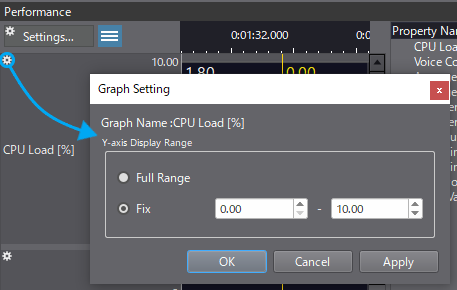
When you press the settings button in the upper-left corner of the Performance Viewer, a window appears that allows you to specify what information to display.
Information dependent on data (such as the number of Cues from a Category being played back) can not be displayed before log acquisition.
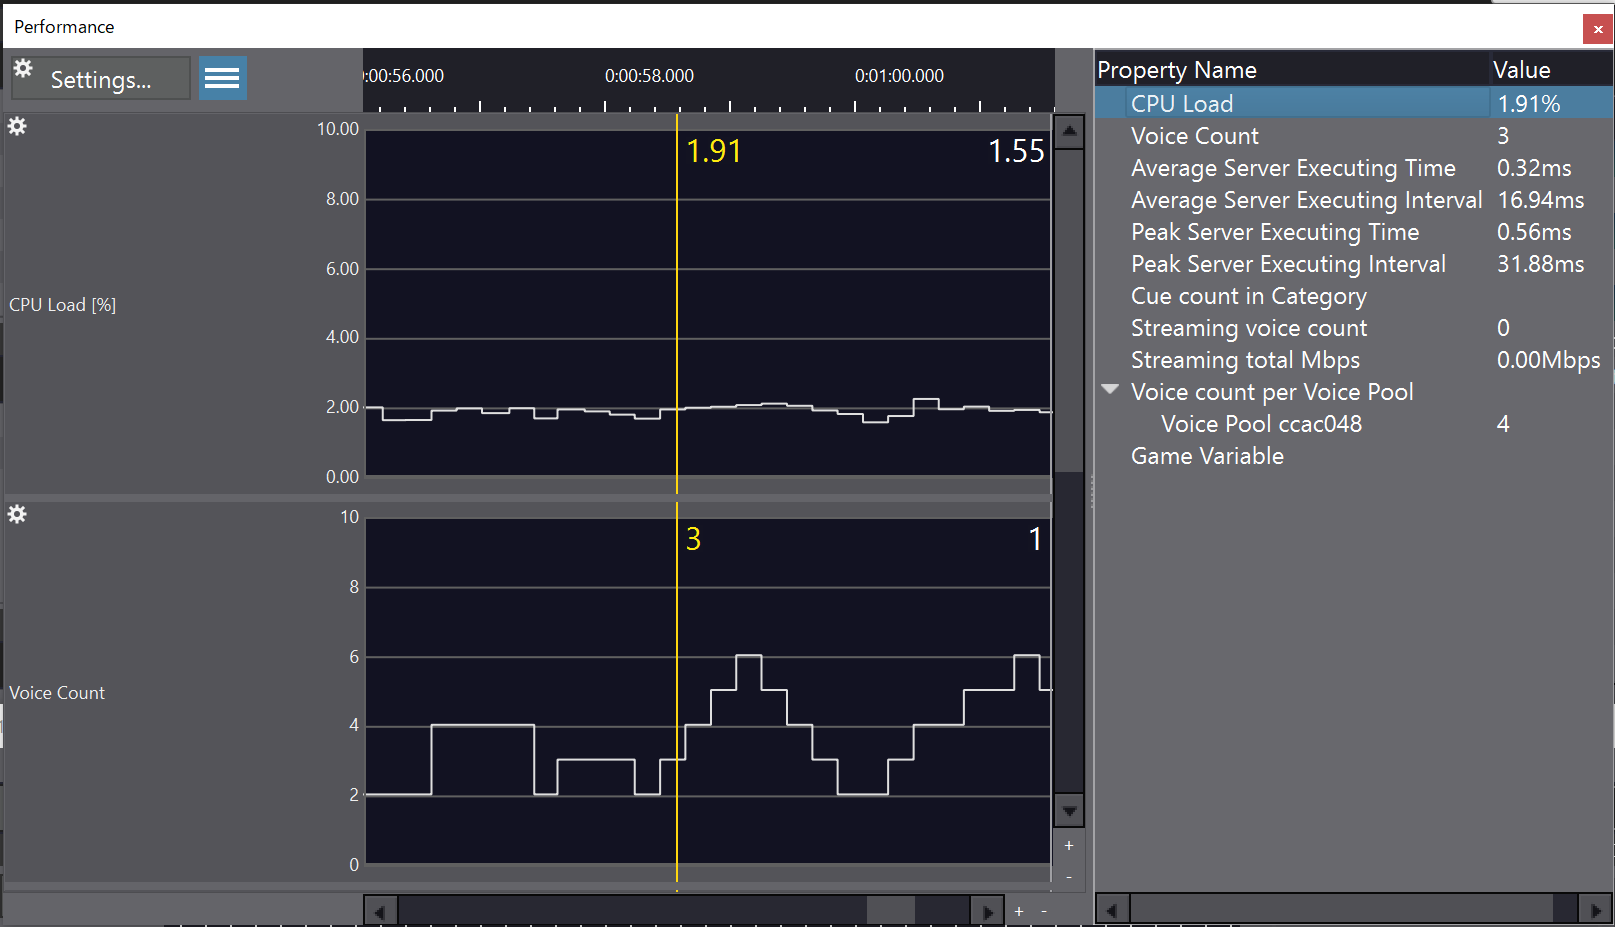
In the upper-left of the Performance Viewer, there is a property button to display the performance value at the specified time.
When this button is pushed, a list of values corresponding to the performance information is displayed.
To increase or decrease the size of the display, use the button or the mouse wheel. For details, see Profiler Viewer .