Summary Viewer
The Summary Viewer displays statistics about the information collected.
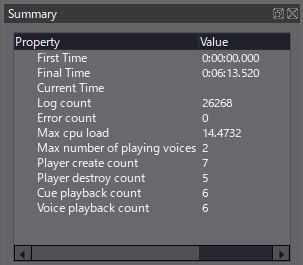
The items displayed are as follows:
List of display items
| Column | Description |
|---|---|
| View start time | Always displayed as 0. |
| View End Time | Shows the time of the last log. |
| Server start time | Displays the time of the log when profiling started in the connected app. |
| Server end time | Displays the time of the last log in the connected app. |
| Total Logs | Displays the total number of logs received. |
| Number of errors | Displays the number of errors that occurred. |
| Warning count | Shows the number of warnings that have occurred. |
| Maximum CPU Load | Shows the maximum number of CPU load information obtained. |
| Maximum Polyphony | Shows the maximum polyphony obtained. |
| Number of times a player has been generated. | Number of times a player has been destroyed. |
| Number of player discards | Displays the number of times a player has been discarded. | Number of times a player has been discarded. |Cue Plays | Shows the number of times the Cue has been played. | |Voice Play Count | Shows the number of times the voice has been played. | |Log Size | Shows the total size of the logs received. |