 |
CRI ADX
Last Updated: 2025-05-07 13:34 p
|
|
CRI ADX
Last Updated: 2025-05-07 13:34 p
|
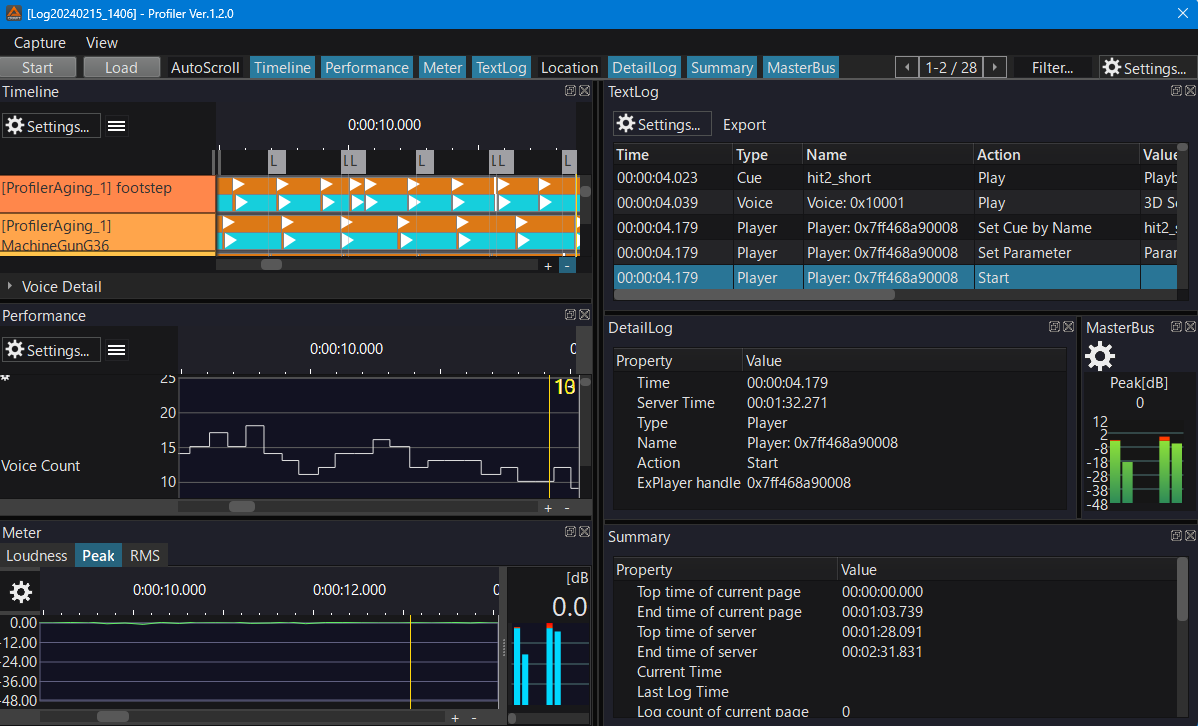
CRI Atom Profiler is an application that collects and visualizes information about sounds played at runtime as logs.
Click the "Start" button to display a dialog box for specifying the connection destination.
Specify the IP address of the application that incorporates the CRI Atom Monitor Library and click "Connect" to automatically start profiling after the connection is complete.
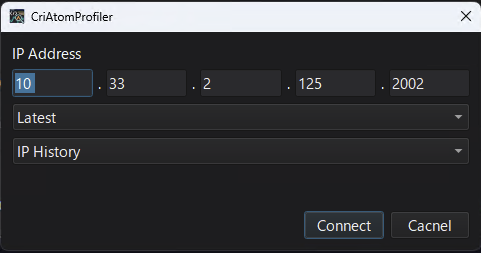
See the following page for details.
The acquired log is automatically saved to a file while it is being recorded.
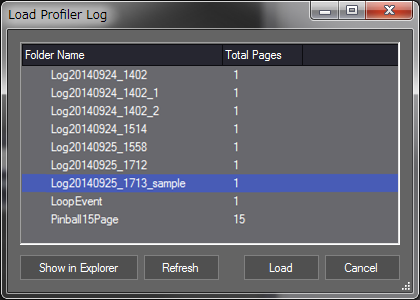
Load and redisplay recorded logs from the menu bar or toolbar.
| Button | Description |
|---|---|
| Show in Finder / Explorer | Opens the folder containing the logs in Finder / Explorer. |
| Refresh | Reloads the logs. You can use it when changing or deleting the name of the logs outside of the profiler. |
| Load | Reads the selected log and close the window. |
| Cancel | Closes the window without loading the logs. |
From the capture menu, you can start / stop the capture, reset, and read the log.
From the display menu, you can set the auto tracking option, switch the viewers, and specify the page to display.
On the toolbar, you can perform the same tasks as on the menu bar, but via the buttons.
For more details about the menu bar and the tool bar, please refer to Profiler window .