- The profiler allows the monitoring of the CRIWARE Plugin performance and status within the Unity editor.
By using it while the editor is running, you can check the CPU and memory usage, as well as the number of voices being played in real-time.
- About the CRI Atom Craft Profiler
The authoring tool "CRI Atom Craft" included in this SDK also includes a profiling feature.
They work in different ways so you can select a profiler based on what your purpose or development method is.
CRI Atom Craft Profiler:
-
It can display a lot of useful data, such as a timeline of the Cue playback events and detailed information about them. It allows for the saving and reloading of logs.
-
This profiler can used in conjunction with the in-game preview function of the Atom Craft tool.
Editor Profiler:
-
Since it is a Unity editor extension, game development and profiling can be done in the same environment.
-
It is implemented in C# script and can easily be expanded by the user.
For details about the CRI Atom Craft profiler, refer to the CRI Atom Craft user's manual.
|
How to use the profiler
- This profiling feature works within the Unity editor and uses the CRIWARE Unity Plug-in.
To use it, follow the steps below:
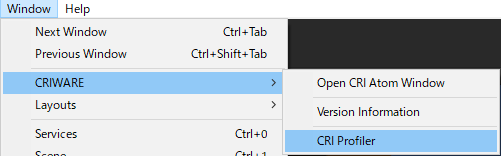
- Choose [Window]->[CRIWARE]->[CRI Profiler] and open the "CRI Profiler Window".
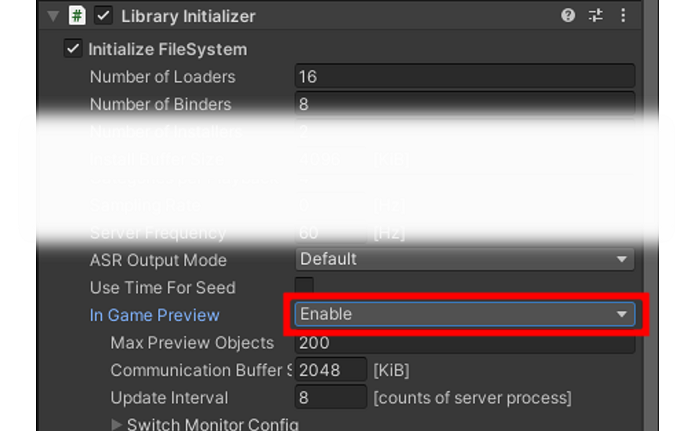
- Select "Enable" in "Uses In Game Preview" of the CRIWARE Library Initializer
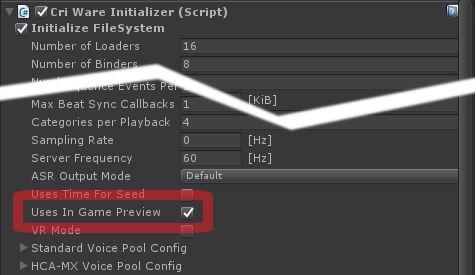
In older versions, check the checkbox to enable it.
Old Version
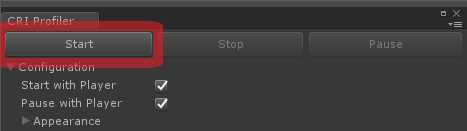
- With the Unity editor running, press the "Start" button on the window to start profiling.
Or run the Unity editor with the "Start with Player" checkbox enabled.
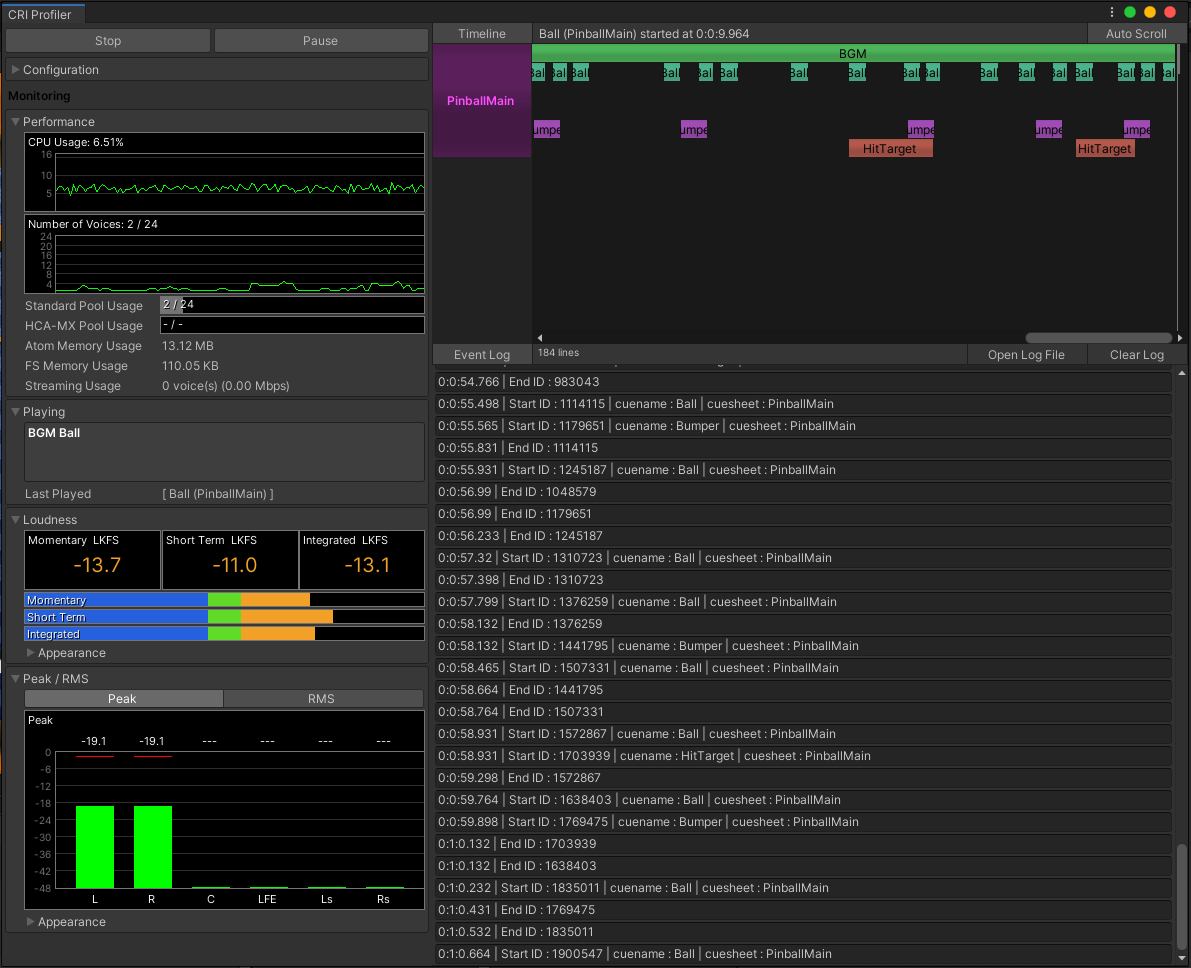
GUI
- Here we explain each part of the CRI Profiler Window.
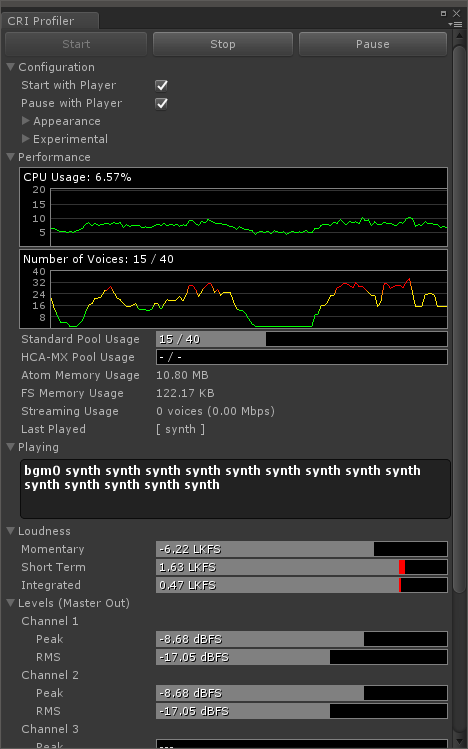
CRI Profiler Window GUI layout
Start / Stop / Pause
- These buttons control the start / stop / pause of the profiling operation.
They only work when the Unity editor is running.
Configuration
- It can change the operation of the editor profiler.
- Start with Player: If this check box is selected, the profiling starts automatically when the Unity editor is running.
- Pause with Player: If this check box is selected, the profiling is paused and resumed when the Unity editor is paused / resumed.
- Save Log File: Save the captured profiling information to a file. If enabled, you can specify the save destination of the file.
- Experimental: Experimental function (described later)
Specifications of this function may be changed in the future.
Performance
- The performance and status of the CRIWARE Plugin is displayed.
- CPU Usage: This graph shows the evolution of the CPU usage by each CRIWARE component
- Number of Voices: This graph shows the evolution of the number of voices being played, the maximum number of voices, and the number of playback voices
- Standard Pool Usage / HCA-MX Pool Usage: This meter indicates the allocation size (maximum value) and usage of the voice pool for each format
When the voice pool size is 0, the maximum value is displayed as "-".
If the usage information of the voice pool has not been updated yet, the current value will be displayed as "-".
In the current specification, for a sound source set to "Play On Start", the usage status of the pool is not updated immediately after the application is started, and "-" is displayed. If the playback / stop of any voice occurs in the same pool after startup, the correct value will be displayed.
- Atom Memory Usage / FS Memory Usage: Memory usage by the Atom or File System components
- Streaming Usage: Number of voices in streaming playback and total bit rate
- Last Played: Name of the Cue that played the last voice
Playing
- The name of the Cue playing a voice is displayed.
Loudness
- The loudness information is displayed.
Peak / RMS
- The level information of each Channel of MasterOut (BUS0) is displayed.
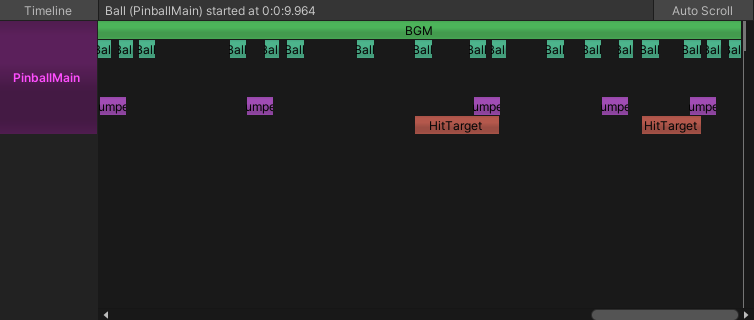
Timeline Display
Voice playback events are displayed on the timeline.
This function can be enabled/disabled with the "Timeline" button on the upper left.
You can switch whether the timeline display automatically scrolls to the end with the "Auto Scroll" button.
When you click on the Block that represents the playback event, the Cue name, Cue Sheet name, and playback time will be displayed in the Tool above.
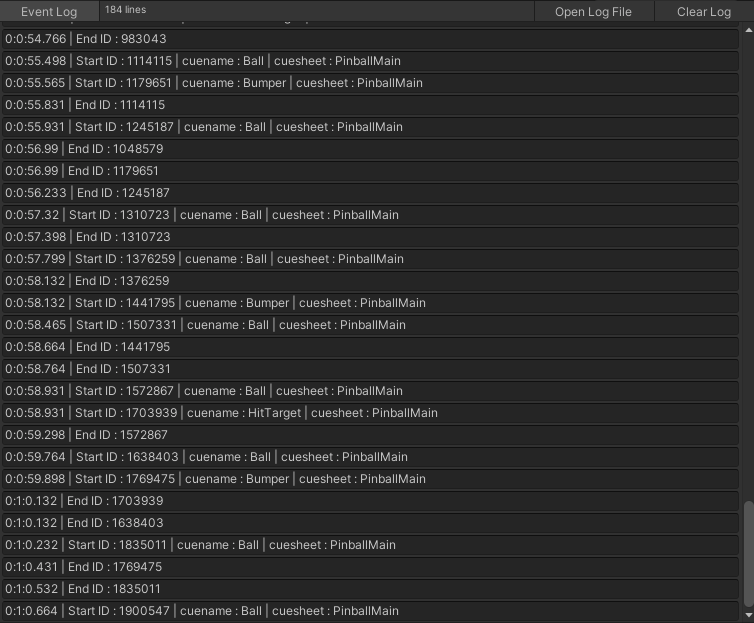
Event Log Display
A list of Voice playback event(s) is displayed.
This function can be enabled/disabled with the "Event Log" button on the upper left.
You can clear the displayed log by clicking the "Clear Log" button.
Using "Open Log File", you can read the log save file specified by Configuration and display the playback event.
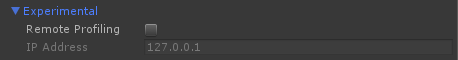
Experimental function: Remote profiling
- By using the remote profiling function, it is possible to profile an application that is already built.
It can connect to the PC running the editor or to another device on the same network.
How to use this feature
- Enable [Configuration]->[Experimental]->[Remote Profiling] in the CRI Profiler Window
- Set the IP address of the terminal to be profiled in "IP Address" character field
- Start the target application on the terminal
- Press the "Start" button and start profiling
- Attention
- The in-game preview function of the target application must be enabled.
The Unity editor does not need to be running.
This function is still experimental and the specifications may change in the future.
Unity console output
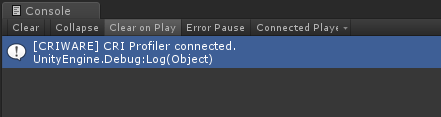
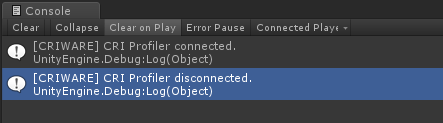
- When starting and stopping the editor profiler, the following log messages are output to the Unity console.
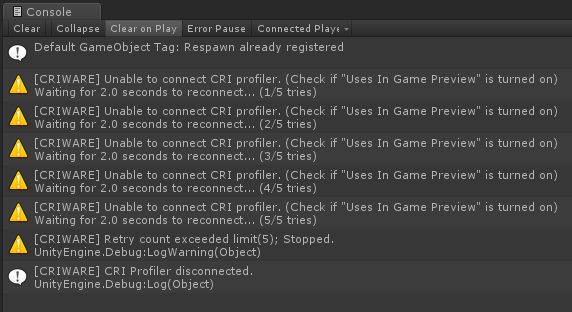
Also, if the Profiler cannot connect to the application because "Uses In Game Preview" is not enabled, or because the connection to the network is unstable (in case of remote profiling) etc., the following warning message will be output and an attempt will be made to reconnect.